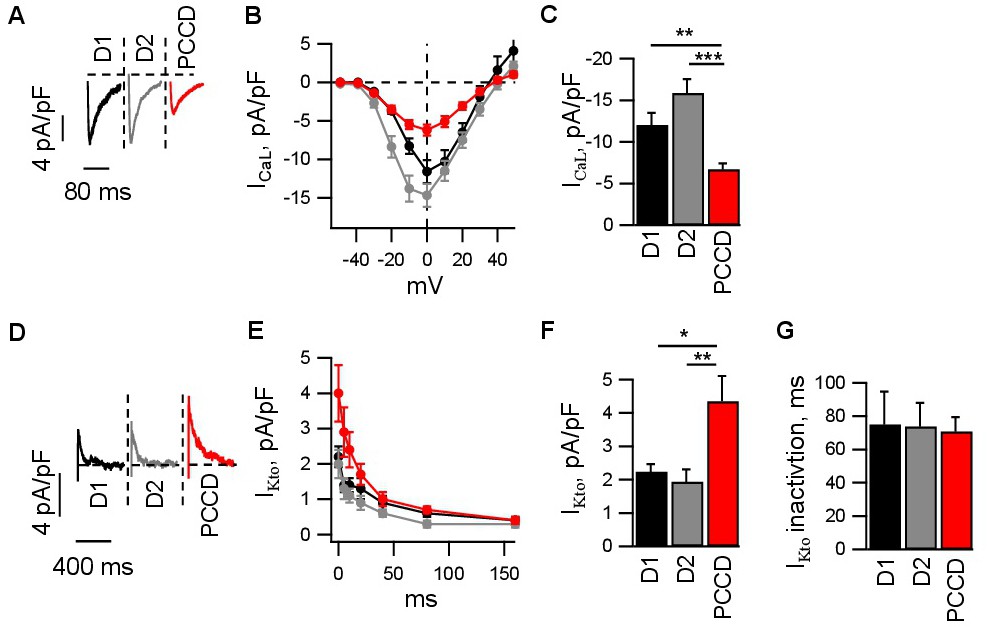
Fig. 3. Effect of DSP-H1684R genetic variant on the amplitude ICaL and IKto. A. Representative traces of ICaL in donor iPSC cardiomyocytes (D1, black; D2, grey) and in PCCD cardiomyocytes (red). B. Current-voltage curves depicting the peak amplitude of ICaL at the indicated voltages. C. Bar plot of maximal ICaL amplitude obtained during measurements of current-voltage relationship. D. Representative traces of IKto in donor iPSC cardiomyocytes and in PCCD iPSC cardiomyocytes. E. Inactivation curves depicting the dependence of the peak amplitude of IKto measured at +60 mV on the duration of depolarizing prepulse to -20 mV. F. Maximal IKto amplitude reflecting amplitude of outward current at +60 mV without depolarization minus amplitude of outward current at +60 mV with 320 ms depolarization prepulse to -20 mV. G. Time of exponential inactivation of IKto amplitude as dependence from the duration of depolarizing prepulse to -20 mV. Asterisk reflects significance (p<0.05), for details see Materials and Methods.